All FarmBots ship FREE
Not applicable to Net 30 POs
A life-cycle analysis of FarmBot’s CO2 emissions vs food from the grocery store
Reading time: 9 minutes
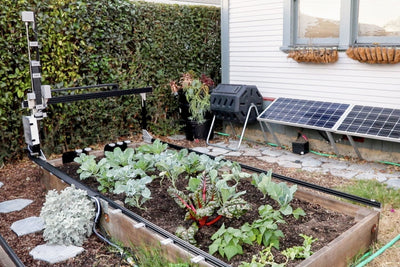
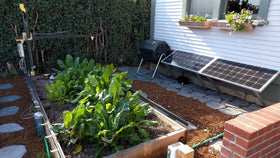
People often want to know how much electricity FarmBot uses. Sometimes they’re wondering if FarmBot can be run on solar power (which it can be). Though more often they are actually searching for an answer to this (slightly more complicated) question: “What is the carbon footprint of owning and operating a FarmBot to produce vegetables compared to buying an equal amount of vegetables from the store?” In this post we’ll look in depth at this question from a theoretical perspective.
First let’s talk about carbon footprint calculations. In general, there are two types of carbon emissions associated with a product:
1. The emissions generated from producing the product. These emissions come from mining, processing raw materials, manufacturing the components/product, and shipping it all to the consumer. These emissions are usually directly related to the embodied energy of the product, though depending on the source of the energy used in production, the total emissions can vary widely. For example: the aluminum used in FarmBot might be from Factory A which uses solar energy (zero emissions), or from Factory B which uses energy from coal. Because we don’t know every detail of the FarmBot supply chain, we don’t know exactly what sources of energy are used to produce a FarmBot. Instead, we will be using published averages for the calculation of these emissions.
2. The emissions generated from using the product. FarmBot uses electricity to operate. The source of that electricity will determine how much CO2 is emitted to operate FarmBot. Because we don’t know if the consumer will be using coal based energy, that from natural gas, wind, solar, or some combination thereof, we will again be using published averages for electricity usage emissions.
Sometimes a third emission is included which accounts for emissions generated after a product’s lifespan. For example, a building might cause more emissions if it needs to be demolished and taken to a landfill when it is time to be replaced. For this post, we are not going to be considering these post-lifespan emissions as FarmBot is a physically small device (compared to a building) and any emissions generated from recycling materials would be attributed to the new product, not FarmBot.
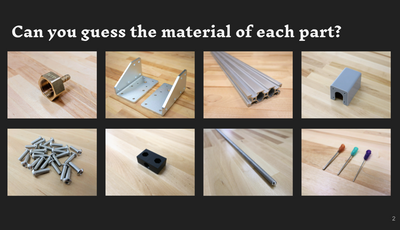
In the table below we list the most prevalent materials used in FarmBot, their cumulative weight, and the expected kg of CO2 emitted due to their production. Keep in mind that these are only estimations meant to provide us with a ballpark idea of the emissions generated to produce a FarmBot.
| Material | Weight (kg) | kg of CO2/kg of material | kg of CO2 |
| Aluminum (extrusions, plates) | 9.5 | 8.24 | 78.3 |
| Stainless Steel (hardware, bearings, driveshaft, leadscrew) | 1.4 | 6.15 | 8.6 |
| Plastic (drag chain, 3D prints, wheels, electronics housings, tubing, circuit boards) | 2.8 | 2.53 | 7.1 |
| Copper (electronics, wiring, motor windings) | 0.3 | 2.60 | 0.8 |
| Rubber (belts, wiring, gaskets) | 0.2 | 3.18 | 0.6 |
| TOTAL | 95.4 kg |
It is important to note that the numbers in the table above are calculating the CO2 emitted for the production of enough raw materials for a FarmBot (raw aluminum billets, raw plastic pellets, etc). Obviously FarmBot is not constructed from raw aluminum or raw plastic – it is constructed from aluminum extrusions and plates, 3D printed plastic parts, screws, wheels, belts, motors, and other non-raw components. In reality, the actual CO2 emitted to produce a FarmBot may be closer to 150kg (330lbs) than 100kg, though we can never truly know without exhaustive research and due diligence.
In this table, we look at the emissions attributed to using FarmBot. While we could consider the emissions associated with the delivery of municipal water, acquiring seeds, and more, we are going to limit our scope to the most obvious emission source: electricity usage. Because we don’t know how a specific consumer’s electricity is produced (coal vs solar vs whatever) we’re going to use the US average for CO2 emissions per kWh of electricity: 0.554 kg CO2/kWh.
Note: Duty cycle refers to the estimated average percentage of time that the component is being used. For example, the computer and microcontroller are always on (100% duty cycle), while the motors are only being used sometimes (estimated at 5% for each motor). As a point of reference, if you have your TV on for 4 hours per day, that is a 16.6% duty cycle. Also keep in mind that we’re including usage of high power 12V tools utilizing the maximum deliverable power, and also an always-on webcam. At the end of the day, these are very rough estimations and the power usage may change considerably depending on how you program and use your FarmBot.
| Component | Power (Watts) | Duty Cycle (%) | Use in 1 Day (Hours) | kWh/day | kWh/year | kg CO2/day | kg of CO2/year |
| Raspberry Pi 2 | 3.0 | 100% | 24.00 | 0.072 | 26.3 | 0.040 | 14.56 |
| Raspberry Pi Camera | 1.5 | 100% | 24.00 | 0.036 | 13.1 | 0.020 | 7.28 |
| Arduino Mega 2560 | 1.0 | 100% | 24.00 | 0.024 | 8.8 | 0.013 | 4.85 |
| 3x NEMA 17 Stepper Motors | 30.0 | 5% | 1.20 | 0.036 | 13.1 | 0.020 | 7.28 |
| 12V tools | 132.0 | 2% | 0.48 | 0.063 | 23.1 | 0.035 | 12.81 |
| Solenoid Valve | 30.0 | 2% | 0.48 | 0.014 | 5.3 | 0.008 | 2.91 |
| Vacuum Pump | 186.0 | 0.5% | 0.12 | 0.022 | 8.1 | 0.012 | 4.51 |
| Web App Server/User | 20.0 | 1% | 0.24 | 0.005 | 1.8 | 0.003 | 0.97 |
| User’s Device (laptop) | 60.0 | 1% | 0.24 | 0.014 | 5.3 | 0.008 | 2.91 |
| TOTALS | 0.287 | 104.9 | 0.159 | 58.09 |
Using these estimations, operating a FarmBot will emit approximately 60kg of CO2/year, or 130lbs. As points of reference, this is equivalent to burning 6.5 gallons of gasoline in your car, and the energy used each day by FarmBot is close to what a desktop computer would use in about an hour and a half. Fun fact: at the average US electricity cost of $0.15/kWh, operating FarmBot for a year will cost about $16.
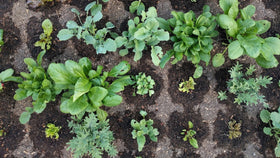
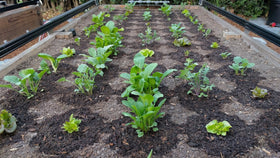
Now that we have a ballpark estimation for the CO2 emissions of FarmBot, let’s see how using FarmBot to grow vegetables compares to buying the same quantity from the store. From our analysis of how much food FarmBot can grow, let’s assume we’re fully utilizing our FamBot and growing 80 calories of vegetables per day. This means that over one year, FarmBot will produce 29,200 calories of vegetables at a cost of 60kg of CO2. This means that the carbon intensity of FarmBot grown vegetables is 2.05 g CO2/calorie.
According to ERS/USDA data seen in the figure below, the average carbon intensity of vegetables grown in the US is 2.8 g CO2/calorie.

Therefore, FarmBot grown vegetables emit 25-30% less CO2 than vegetables bought at the store
Keep in mind that this is not taking into account the CO2 emitted for the production of FarmBot itself (150kg), though the CO2 emitted from the production of industrial tractors, transportation trucks, highways, and grocery store buildings are not included in the 2.8 g CO2/calorie number either. Considering the difference in materials used in the US food supply chain vs the materials used in a FarmBot, we can only imagine that taking all that into account with an exhaustive study would only prove FarmBot to be an even more attractive food production system from a CO2 emissions standpoint. So let’s add FarmBot into the plot! Fits in nicely, huh?

- This analysis is assuming you use average US electricity. If you run your FarmBot off of solar energy, then the CO2 cost of FarmBot grown veggies goes to near zero g CO2/calorie! The only emissions would come from the usage of the web app server and your laptop/phone (unless your whole home is solar powered and you run the web app locally!)
- Because FarmBot grown veggies are grown in your backyard, there will be no carbon cost associated with getting the veggies from the field to your fork. With store-bought veggies, you might normally drive to the store – an emissions source not accounted for in our data from the ERS/USDA. And that source could be huge. Remember, the amount of emissions FarmBot emits in an entire year is equivalent to burning just 6.5 gallons of gas. If you drove to a grocery store or farmer’s market 2.5 miles from your home once every week in a vehicle that gets 30 mpg to pickup veggies, then you would burn over 8 gallons of gas in a year, effectively doubling the carbon cost of those store-bought veggies.
- Because of these reasons and the conservative numbers we’ve used in our calculations above, we suspect that in reality FarmBot grown veggies will outperform store-bought veggies by an even greater amount than this analysis has suggested, especially if extra steps are taken to make FarmBot less carbon intensive, such as going solar.